
>> Read the latest update here <<
Over the last month, the CarStory Data Science team has been working hard to help dealers understand how COVID is impacting the used car market.
Through our discussions, dealers keep asking the same questions. What signs should we use to predict when the market is going to get back to normal? Given the current market instability, how much pricing risk exists?
To measure and track volatility in the used car market, we’ve developed the CarStory VIX. It’s an index to measure the degree to which used car inventory is changing. By analyzing sales volumes, acquisition rates, and days on lot, we believe we can identify the stability of the market.
In the perfect case, if the % of acquisitions, sales, and inventory age are all steady, the VIX = 1.0. If the VIX is between 1-3, we consider that low volatility, between 3-9 is medium and greater than nine is high.
Here is a plot of the CarStory VIX across the country since the start of 2019. As you can see before March 2020, the index was very stable, averaging just under 1.6. This shows us that the market had a steady flow of sales, inventory added to the lot, and a healthy turn rate. However, in the last month, the VIX spiked indicating some severe challenges.
May 8th Update – after a week of dramatic improvements, market volatility is picking back up. We reached a peak of 4.9 on April 10th, dropped all the way to 1.8 on the 28th, and are now sitting at a 3.6. This is more than 2 times the volatility we saw in the market pre-COVID.
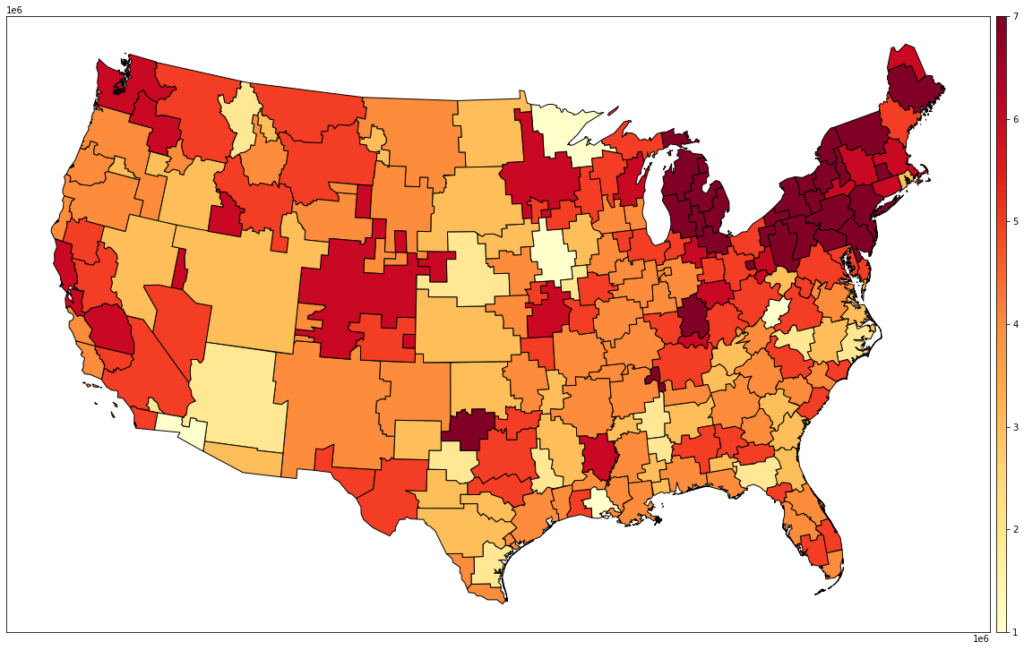
Used Car Market Volatility in Major Metros
To illustrate how the VIX is improving across the country, we mapped the VIX by the major areas of the United States. The first chart below highlights the day the VIX hit its peak of 5.2 on April 9th.
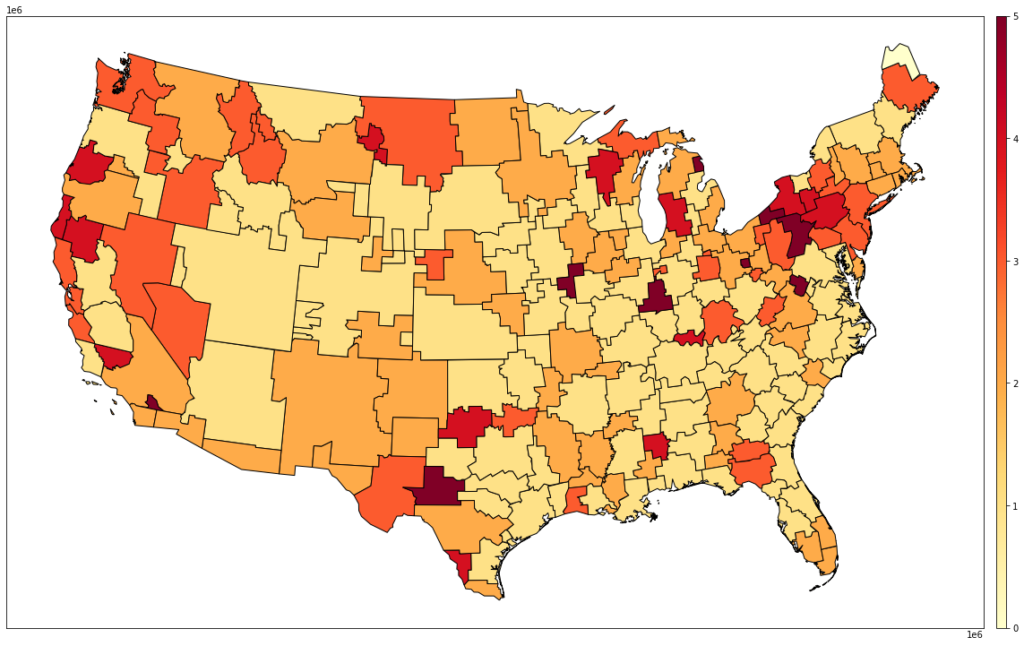
Today, the VIX is down to a 1.8 and continues to improve. Mapping the individual VIX results across the country you can quickly see how things are improving and where instability still exists.
As expected, depending on a state’s or city’s restrictions, the volatility varies. In the chart below, we show the VIX charts across six major DMAs as well as the national index.
San Francisco was the first city to spike, which lines up with the fact that they initiated a lock-down sooner than most. They reached peak volatility on April 8th and are starting to show some signs of recovery.
Both Detroit and New York City had massive spikes in April as well. However, they’ve started to retreat from those peaks. Detroit is still in the high volatility zone. Meanwhile, New York City has shown significant improvement and is now at a medium VIX.
New Orleans, Chicago, and Seattle are also in the medium bucket. Both Chicago and New Orleans appear to be fairing the best. Chicago, in particular, has shown steady improvements over the last seven days.
We will continue to publish the CarStory VIX, as well as our other statistics. We are all anxiously awaiting the market to return to normal. As it relates to this index, it’s worth pointing out that once we reach stability, it may represent a new normal, not exactly the market we enjoyed over the last 12-18 months.
As with our other analysis, we calculate the CarStory VIX using data from approximately 27,000 dealerships. Across all six DMAs, we see roughly 3,000 dealerships and 680,000 used units.
What is the actual calculation for the VIX? Is it effectively inventory aquisitions in the numerator, and retail sails in the denominator?
VIX is composed of two components:
The rate of change in inventory age (computed from the first and second derivatives of the inventory age curve) and the deviation (each day) of the % of inventory that is new listings.
In a static market, where inventory age is constant and the % of listings that are new listings is constant, both components will = 1.0. The VIX is the product of these two numbers and will be 1.0 in a static market.
As either component starts to move, the value for that component is > 1.0, and the VIX will be > 1.0.