Over the last week, the automotive market has shown tremendous improvement. It’s clear now that April was the bottom of the dip. We’re now seeing improvements in every metric we track. While certain locations are on a slow recovery pace, overall the data is encouraging.
In this post, we’ll summarize the latest results of our analysis. If you haven’t read our original posts on these charts, I’d encourage you to check out our COVID tracker and the CarStory VIX post.
As you know by now, the CarStory VIX measures and tracks volatility in the used car market. It’s an index to determine the degree to which used car inventory is changing. By analyzing sales volumes, acquisition rates, and days on lot, we can identify the level of volatility in the market.
As you can see from the chart below, the VIX spiked to it’s highest level of almost 13.
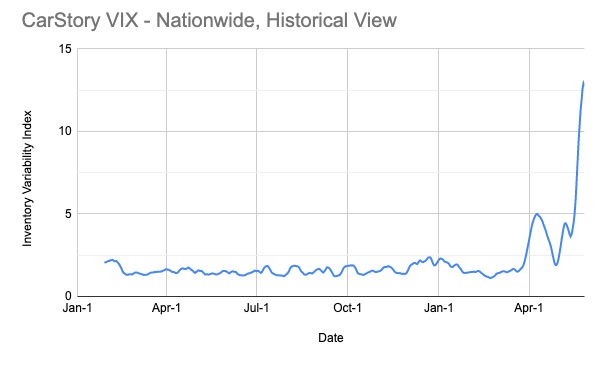
So why the spike? The VIX is composed of two components: The rate of change in inventory age and the deviation (each day) of the % of new inventory. In a static market, where inventory age is constant and the % of listings that are new listings is constant, both components will = 1.0. The VIX is the product of these two numbers and will be 1.0 in a static market. As either component starts to move, the value for that component is > 1.0, and the VIX will be > 1.0.
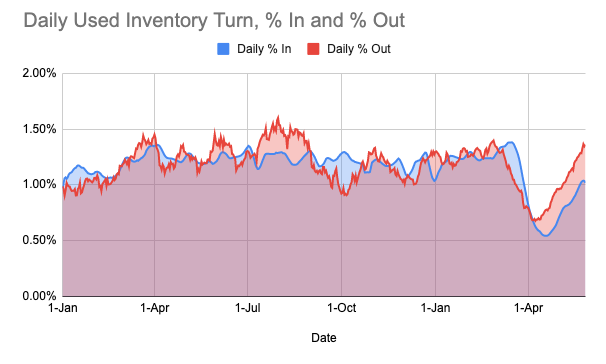
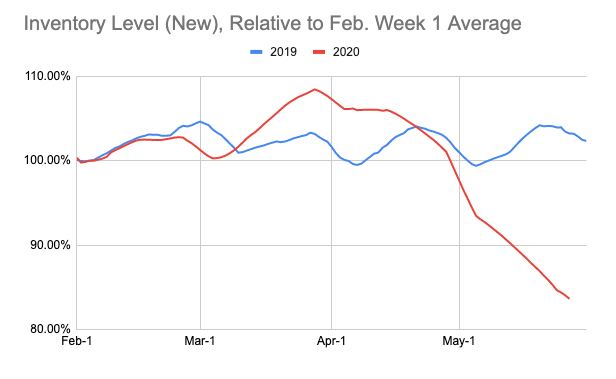
When you look at the % of new listings relative to sold units, the two lines are in lockstep and growing. In fact, sales rates are almost at pre-COVID levels, with new inventory acquisition still lagging.
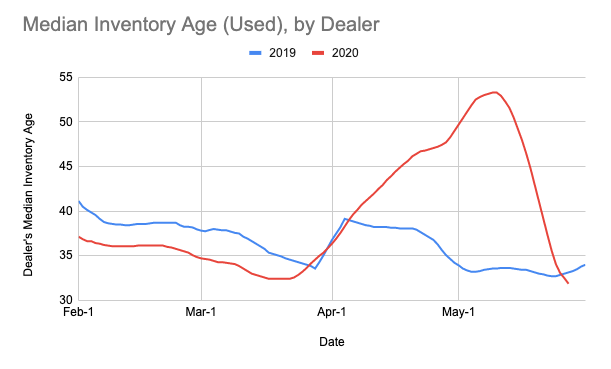
The driver of the volatility is the median inventory age. It dropped precipitously from its peak over 54 days, to 33. This is a level we haven’t seen this year and is also better than what we saw in the first part of 2019. The severity of this change was massive and that shows up in the VIX spiking.
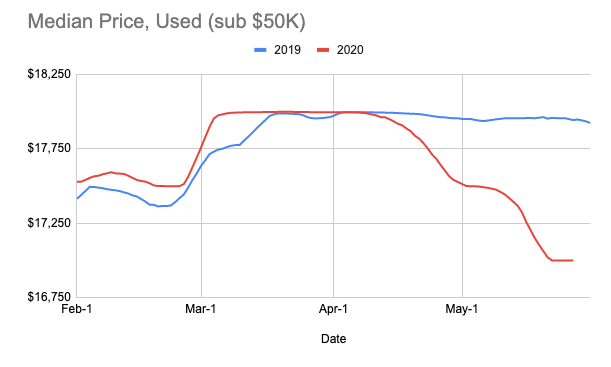
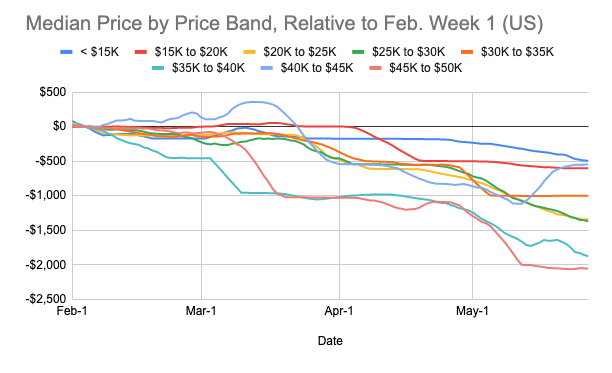
What about prices. Over the last few months, we’ve seen median prices drop across the board. When looking at all used inventory under $50k the median price has dropped to under $17k for the first time this year. This is the lowest level we’ve seen in 2020 or 2019. The good news is that it appears to be leveling off this week.
When you look closer at different price bands you can see improvement or stabilization as well. Every band is leveling off their lows with the exception of vehicles in the $35-40k and $40-45k range. The first group is still seeing price erosion, whereas the latter is showing over a $500 price improvement.
With new inventory levels continuing to fall to levels we haven’t seen in years, we fully expect retail prices to rebound in the coming months. We’ll be monitoring the entire market closely and will continue to report out on what we see. As always, if you have comments or questions, please post them below.
Pingback: How is COVID-19 Impacting the Used Car Market? - CarStory
Pingback: CarStory VIX - Used Car Market Volatility Index - CarStory
could you imagine what this data looks like over the COVID, and the following bubble?